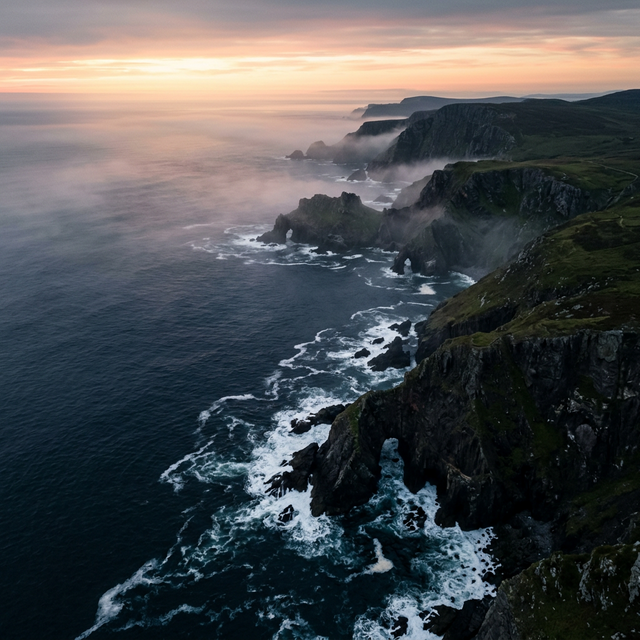
Numerical Modeling & GIS
Hazard Mapping.
Visualizing the invisible: The intersection of high-resolution topography and advanced fluid dynamics.
Numerical Modeling & GIS
Visualizing the invisible: The intersection of high-resolution topography and advanced fluid dynamics.
Spatial Analysis
Tsunami hazard mapping is the foundational science of coastal resilience. It is the process of delineating the landward extent of potential tsunami flooding based on rigorous numerical simulations. These maps are not merely visual aids; they are legally binding documents used for urban planning, building code enforcement, and the design of life-saving evacuation routes.
At the Tsunami Evaluation Institute, we distinguish between two types of mapping: *Inundation Mapping*, which focuses on the maximum physical extent of water reach, and *Evacuation Mapping*, which adds layers of human behavior, road capacity, and safety margins to ensure that every resident has a clear path to high ground. Our process begins with the "Bare Earth" Digital Elevation Model (DEM), where we use Lidar data to remove vegetation and man-made structures, exposing the true topography that dictates wave behavior.
By integrating high-resolution topographical data with offshore bathymetry, we create a seamless grid that allows our models to simulate how a wave transforms from a deep-ocean swell into a destructive wall of water as it enters the shallow-water environment of the littoral zone. This "shoaling" effect is captured through multi-scale nested grids that progressively increase in resolution from kilometers to meters.
Numerical Methodology
We utilize industry-standard numerical codes, including COMCOT (Cornell Multi-grid Coupled Tsunami Model) and MOST (Method of Splitting Tsunami), to solve the governing equations of fluid flow.
These models solve the non-linear shallow water equations—a simplified version of the Navier-Stokes equations that are highly effective for waves whose length is much greater than the water depth. To achieve high precision in complex near-shore environments like harbors and estuaries, we employ a "Nested Grid" approach. This involves running the simulation on a coarse global grid for the deep ocean and progressively finer, high-resolution grids as the wave approaches the target coastline. This ensures that features like sea walls, breakwaters, and coastal roads are accurately represented.
One of the most technically challenging aspects is the "Moving Boundary" scheme, which tracks the precise location of the shoreline as it moves inland during the run-up phase. This allows us to calculate not just how high the water will go, but also the "Momentum Flux"—the force of the flowing water—which is often what causes structural failure. We also account for "Manning's n," a coefficient of roughness that represents different types of land cover, from smooth concrete to high-friction mangrove forests.
Data Integration
A model is only as good as its data. We bridge the gap between satellite-derived imagery and ground-truth laser surveys.
Light Detection and Ranging (Lidar) technology uses laser pulses to map the earth's surface with centimeter-level accuracy. By deploying aerial Lidar surveys, we can capture the "Vertical Roughness" of a town, including every minor hill, levee, and seawall that might deflect or channel tsunami energy. This data is critical for identifying potential "Safe Havens"—natural high grounds that are accessible within a 15-minute walk from the shoreline. Without high-resolution Lidar, inundation maps can over- or under-estimate flooding by hundreds of meters.
Understanding the sea floor (bathymetry) is equally important. Submarine canyons can focus wave energy toward specific coastal sectors, while shallow continental shelves can cause waves to "shoal" or grow in height. We integrate Multi-Beam Echosounding (MBES) data to create detailed 3D maps of the seafloor, ensuring that our propagation models account for the refraction and diffraction of wave energy. The transition zone between deep ocean bathymetry and high-res topography is the most critical area for model accuracy.
No model is perfectly predictive. We account for uncertainty by running "Ensemble Simulations." This involves varying the earthquake source parameters—magnitude, fault orientation, and slip distribution—to see how sensitive the inundation zones are to small changes in the source. This is the hallmark of Probabilistic Tsunami Hazard Analysis (PTHA).
Building codes often require designing for the "Maximum Considered Tsunami" (MCT), but as we saw in Japan in 2011, sometimes nature exceeds our expectations. PTHA helps us move beyond a single "design tsunami" to a comprehensive understanding of risk over 50, 100, and 500-year return periods. This is vital for the design of critical infrastructure, such as nuclear power plants and hospital complexes. Our collaboration with Genetic Archaeology allows us to refine these return periods through isotopic and geological markers in ancient sediment layers.
By quantifying this uncertainty, we provide stakeholders with a "Confidence Interval" for our hazard maps. This allows urban planners to make informed decisions about where to place mandatory evacuation zones and where to allow higher-density residential development. The institute is also pioneering AI-assisted mapping that can generate inundation predictions in seconds based on real-time seismic inputs, providing a vital tool for emergency managers during an active event.
Applied Excellence
Modeling how wave energy channels through high-density urban streets to identify "dead-end" traps and optimized vertical evacuation sites.
Securing power substations and water treatment plants by modeling hydrodynamic pressure and debris impact risks in the inundation zone.
Evaluating the effectiveness of mangrove forests and dunes in attenuating wave energy through high-friction roughness modeling in COMCOT.